skip to main
|
skip to sidebar
Advanced Digital Cartography- 411
Sunday, November 4, 2007
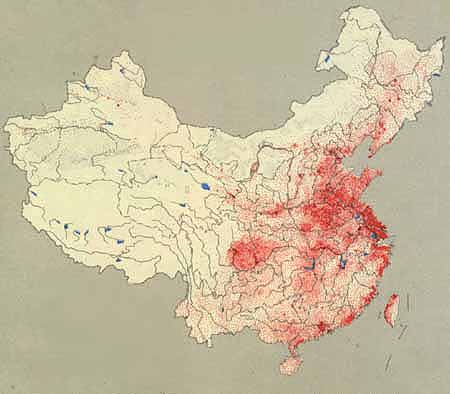
Dot density map of China's population. A dot represents 50,000 people.
Source:
http://depts.washington.edu/chinaciv/geo/1zgzpopu.jpg
No comments:
Post a Comment
Newer Post
Older Post
Home
Subscribe to:
Post Comments (Atom)
Links
Class Blog 411
GIS and Mapping Crime
Careers in Cartography/GIS
GIS Development
GMU Department of Geography
Class Blog
Blog Archive
►
2008
(14)
►
May
(1)
►
April
(4)
►
March
(4)
►
February
(3)
►
January
(2)
▼
2007
(20)
►
December
(2)
▼
November
(5)
The correlation between the two variables is not a...
This is a side-by-side bivariate map. Kind of har...
Color map
Map of West Virginia's Irish population by county.
Dot density map of China's population. A dot repre...
►
October
(9)
►
September
(4)
About Me
David Labban
View my complete profile
No comments:
Post a Comment