Monday, November 26, 2007
Saturday, November 24, 2007
 This is a side-by-side bivariate map. Kind of hard to find.
http://www.geog.le.ac.uk/russianheartland/DemographicMaps/images/PopulationMaps/RaionMaps/7RaionPopDenPerCh8902.jpg
Wednesday, November 14, 2007
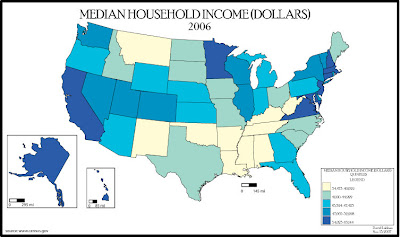
Color map
 Since this lab is being graded on the web, this was the first time when the layout was the main focus. As you can tell from my greyscale map, I never really took the time in trying to fix my layout and I found it to be pretty difficult. As for the color, I find the web version to be quite dull but it may be just the screen. The blues seem to be more similar on the web version but on the printed version each shade of blue really stands out.
Wednesday, November 7, 2007
Sunday, November 4, 2007

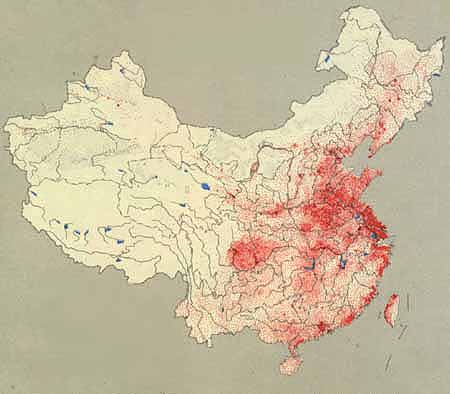
Dot density map of China's population. A dot represents 50,000 people.
Source:http://depts.washington.edu/chinaciv/geo/1zgzpopu.jpg
Subscribe to:
Comments (Atom)
